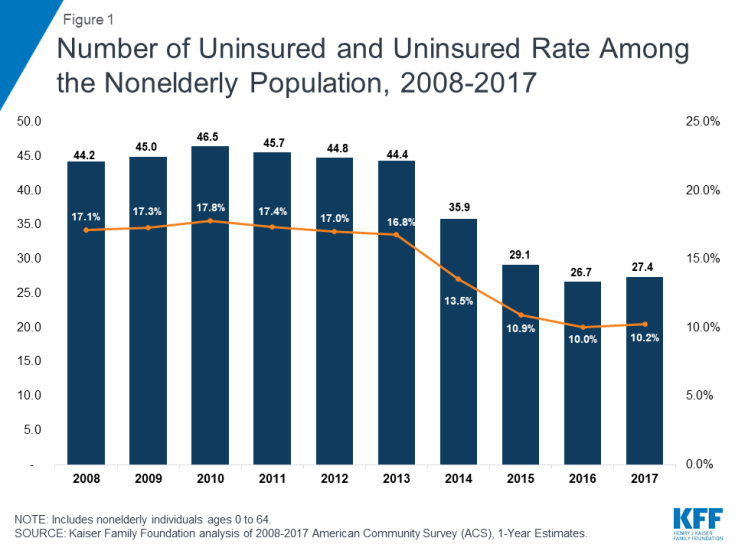
Figure 1: Number of Uninsured and Uninsured Rate Among the Nonelderly Population, 2008-2017
Published: Dec 07, 2018 - The Henry J. Kaiser Family Foundation
The Affordable Care Act (ACA) led to historic gains in health insurance coverage by extending Medicaid coverage to many low-income individuals and providing Marketplace subsidies for individuals below 400% of poverty. The number of uninsured nonelderly Americans decreased from over 44 million in 2013 (the year before the major coverage provisions went into effect) to just below 27 million in 2016. However, in 2017, the number of uninsured people increased by nearly 700,000 people, the first increase since implementation of the ACA. Ongoing efforts to alter the ACA or to make receipt of Medicaid contingent on work may further erode coverage gains seen under the ACA. This fact sheet describes how coverage has changed in recent years, examines the characteristics of the uninsured population, and summarizes the access and financial implications of not having coverage.
| Summary: Key Facts about the Uninsured Population |
| How many people are uninsured?In the past, gaps in
the public insurance system and lack of access to affordable private
coverage left millions without health insurance. Beginning in 2014, the
ACA expanded coverage to millions of previously uninsured people through
the expansion of Medicaid and the establishment of Health Insurance
Marketplaces. Data show substantial gains in public and private insurance
coverage and historic decreases in the number of uninsured people under
the ACA, with nearly 20 million gaining coverage. However, for the first
time since the implementation of the ACA, the number of uninsured
increased by more than half a million in 2017.
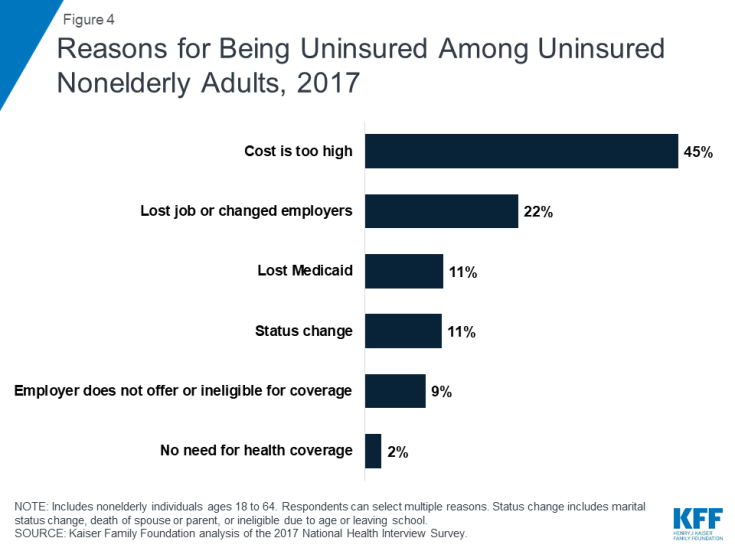
Why do people remain uninsured?Even under the ACA, many uninsured people cite the high cost of insurance as the main reason they lack coverage. In 2017, 45% of uninsured adults said that they remained uninsured because the cost of coverage was too high. Many people do not have access to coverage through a job, and some people, particularly poor adults in states that did not expand Medicaid, remain ineligible for financial assistance for coverage. Some people who are eligible for financial assistance under the ACA may not know they can get help, and undocumented immigrants are ineligible for Medicaid or Marketplace coverage. Who remains uninsured? How does not having coverage affect health care
access? What are the financial implications of being
uninsured? |
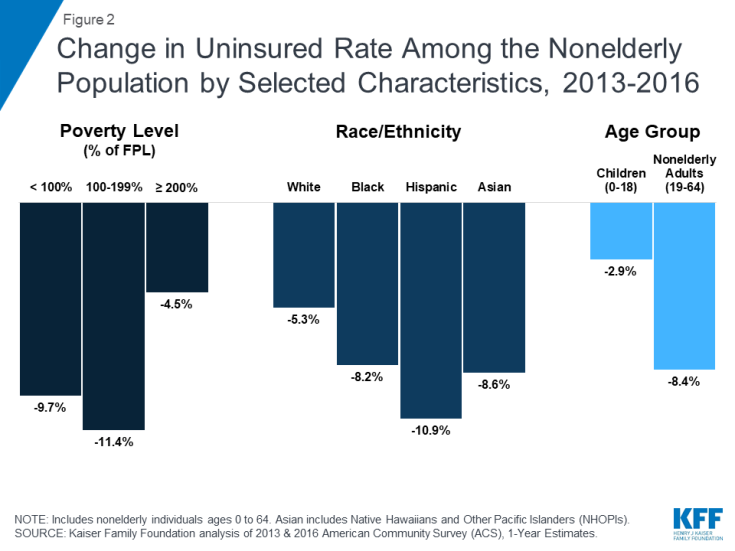
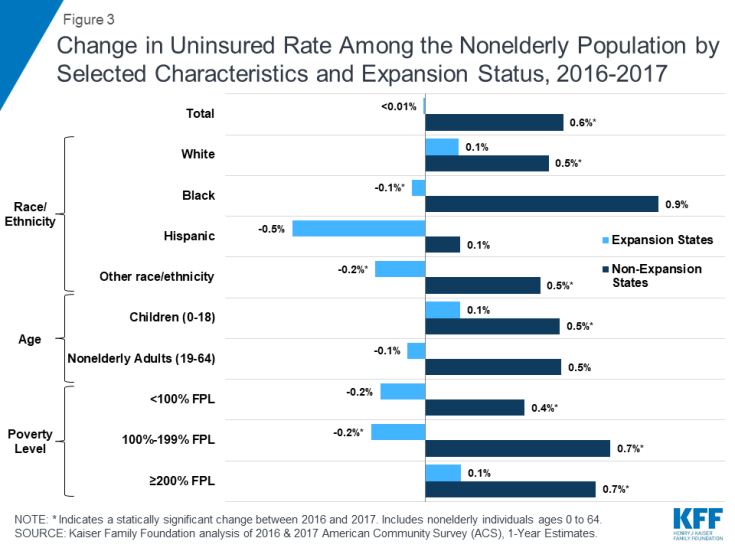
In the past, gaps in the public insurance system and lack of access to affordable private coverage left millions without health insurance, and the number of uninsured Americans grew over time, particularly during periods of economic downturns. By 2013, more than 44 million people lacked coverage. Under the ACA, as of 2014, Medicaid coverage has been expanded to nearly all adults with incomes at or below 138% of poverty in states that have expanded their programs, and tax credits are available for people who purchase coverage through a health insurance marketplace. Millions of people have enrolled in these new coverage options, and the uninsured rate dropped to a historic low. Coverage gains were particularly large among low-income adults living in states that expanded Medicaid. Still, millions of people—27.4 million nonelderly individuals in 2017—remain without coverage.1
Figure 1: Number of Uninsured and Uninsured Rate Among the Nonelderly Population, 2008-2017
Figure 2: Change in Uninsured Rate Among the Nonelderly Population by Selected Characteristics, 2013-2016
Figure 3: Change in Uninsured Rate Among the Nonelderly Population by Selected Characteristics and Expansion Status, 2016-2017
Most of the nonelderly in the United States obtain health insurance through an employer, but not all workers are offered employer-sponsored coverage or, if offered, can afford their share of the premiums. Medicaid covers many low-income individuals, and financial assistance for Marketplace coverage is available for many moderate-income people. However, Medicaid eligibility for adults remains limited in some states, and few people can afford to purchase coverage without financial assistance. Some people who are eligible for coverage under the ACA may not know they can get help, and others may still find the cost of coverage prohibitive.
Figure 4: Reasons for Being Uninsured Among Uninsured Nonelderly Adults, 2017
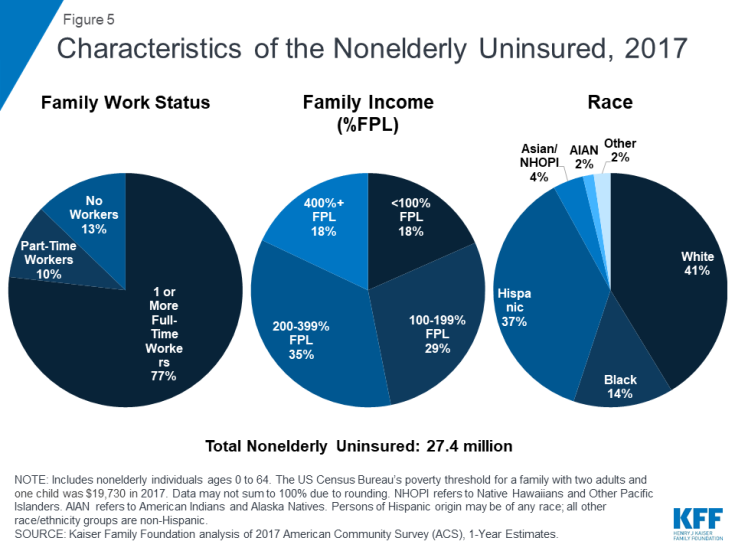
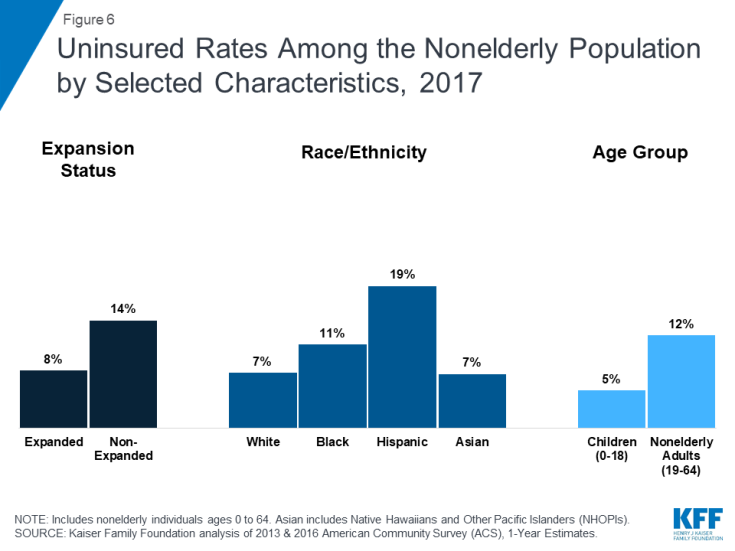
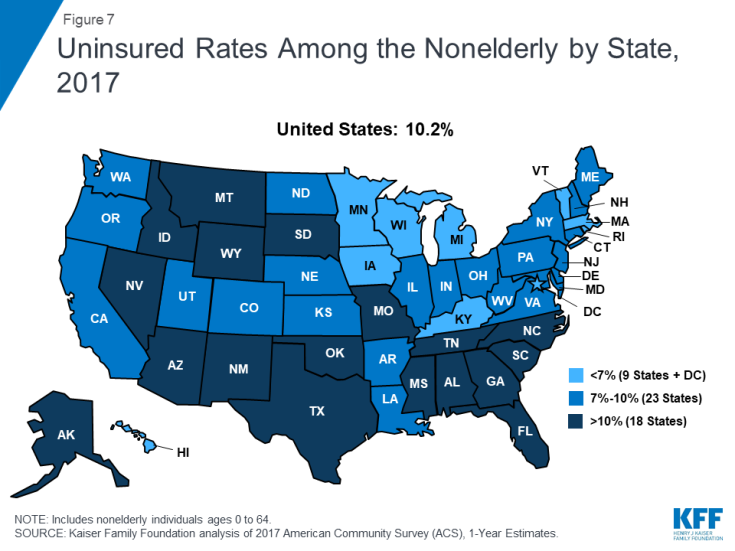
Most remaining uninsured people are in working families, are in families with low incomes, and are nonelderly adults.17 Reflecting income and the availability of public coverage, people who live in the South or West are more likely to be uninsured. Most who remain uninsured have been without coverage for long periods of time. (See Appendix Table B for detailed data on the uninsured population.)
Figure 5: Characteristics of the Nonelderly Uninsured, 2017
Figure 6: Uninsured Rates Among the Nonelderly Population by Selected Characteristics, 2017
Figure 7: Uninsured Rates Among the Nonelderly by State, 2017
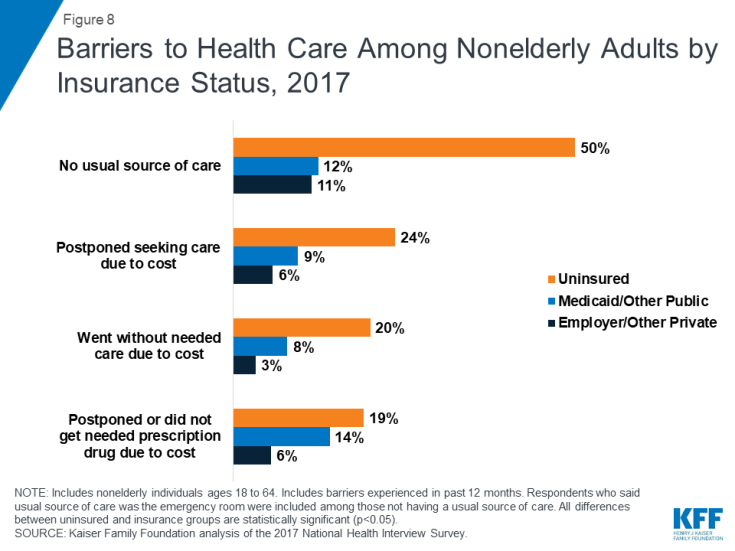
Health insurance makes a difference in whether and when people get necessary medical care, where they get their care, and ultimately, how healthy they are. Uninsured adults are far more likely than those with insurance to postpone health care or forgo it altogether. The consequences can be severe, particularly when preventable conditions or chronic diseases go undetected.
Figure 8: Barriers to Health Care Among Nonelderly Adults by Insurance Status, 2017
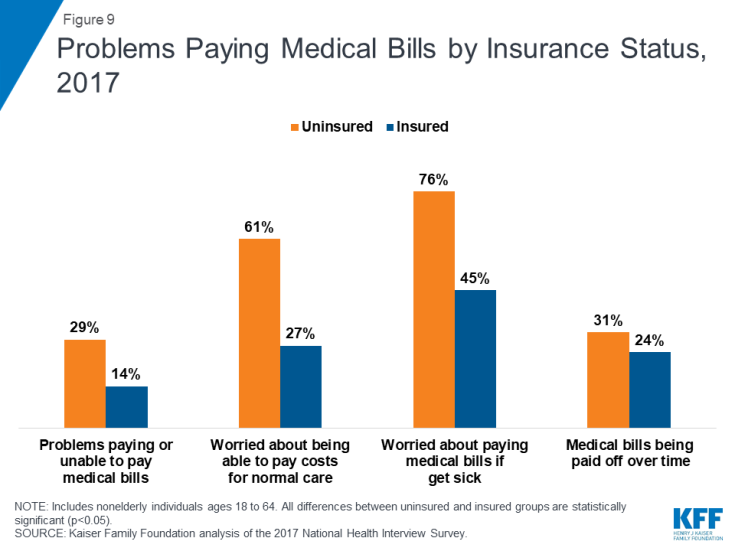
The uninsured often face unaffordable medical bills when they do seek care. These bills can quickly translate into medical debt since most of the uninsured have low or moderate incomes and have little, if any, savings.38
Figure 9: Problems Paying Medical Bills by Insurance Status, 2017
Millions of people gained coverage under the ACA, but recent trends in insurance coverage indicate that coverage gains may be eroding. In 2017, 27.4 million people lacked health coverage, up slightly from 2016. Ongoing debate about altering the ACA or limiting Medicaid to populations traditionally served by the program could lead to further loss of coverage. On the other hand, if additional states opt to expand Medicaid as allowed under the ACA, there may be additional coverage gains as low-income individuals gain access to affordable coverage. Going without coverage can have serious health consequences for the uninsured because they receive less preventive care, and delayed care often results in serious illness or other health problems. Being uninsured also can have serious financial consequences. The outcome of ongoing debate over health coverage policy in the United States has substantial implications for people’s coverage, access, and overall health and well-being.
| Appendix Table A: Uninsured Rate Among the Nonelderly by State, 2013-2017 | |||||||
| 2013 Uninsured Rate |
2016 Uninsured Rate |
2017 Uninsured Rate |
Change in Uninsured Rate 2013-2017 |
Change in Number of
Uninsured 2013-2017 |
Change in Uninsured Rate 2016-2017 |
Change in Number of
Uninsured 2016-2017 | |
| US Total | 16.8% | 10.0% | 10.2% | -6.6% | -17,037,000 | 0.2% | 684,800 |
| Expansion States | 15.1% | 7.7% | 7.6% | -7.4% | -12,070,200 | 0.0% | 4,400 |
| Alaska | 20.5% | 16.0% | 15.5% | -4.9% | -32,900 | -0.5% | -4,900 |
| Arizona | 20.4% | 11.9% | 12.0% | -8.4% | -435,600 | 0.1% | 11,600 |
| Arkansas | 19.0% | 9.5% | 9.6% | -9.5% | -230,300 | 0.1% | 2,400 |
| California | 19.4% | 8.4% | 8.2% | -11.2% | -3,619,900 | -0.2% | -48,700 |
| Colorado | 15.8% | 8.7% | 8.6% | -7.2% | -306,600 | -0.1% | -3,400 |
| Connecticut | 10.9% | 5.7% | 6.6% | -4.3% | -129,900 | 0.9% | 25,600 |
| Delaware | 11.8% | 6.8% | 6.6% | -5.2% | -38,600 | -0.1% | -1,000 |
| District of Columbia | 7.2% | 4.5% | 4.1% | -3.1% | -15,000 | -0.4% | -1,900 |
| Hawaii | 8.2% | 4.1% | 4.5% | -3.7% | -41,800 | 0.4% | 3,200 |
| Illinois | 14.5% | 7.5% | 7.9% | -6.6% | -739,500 | 0.4% | 37,400 |
| Indiana | 16.3% | 9.4% | 9.8% | -6.5% | -358,700 | 0.4% | 23,300 |
| Iowa | 10.3% | 4.8% | 5.2% | -5.1% | -129,900 | 0.4% | 9,400 |
| Kentucky | 16.8% | 6.0% | 6.4% | -10.4% | -380,900 | 0.4% | 14,700 |
| Louisiana | 19.2% | 11.9% | 9.7% | -9.6% | -375,800 | -2.2% | -85,600 |
| Maryland | 11.5% | 7.0% | 7.1% | -4.4% | -220,500 | 0.1% | 6,100 |
| Massachusetts | 4.4% | 2.9% | 3.2% | -1.2% | -63,200 | 0.3% | 18,900 |
| Michigan | 12.9% | 6.3% | 6.1% | -6.9% | -571,800 | -0.2% | -19,400 |
| Minnesota | 9.6% | 4.9% | 5.2% | -4.3% | -194,900 | 0.3% | 15,000 |
| Montana | 19.9% | 10.1% | 11.0% | -8.9% | -72,700 | 0.8% | 7,200 |
| Nevada | 23.5% | 12.8% | 12.9% | -10.6% | -235,000 | 0.1% | 6,100 |
| New Hampshire | 12.8% | 7.6% | 6.8% | -6.0% | -66,400 | -0.8% | -9,000 |
| New Jersey | 15.4% | 8.9% | 8.9% | -6.5% | -488,200 | 0.0% | -1,000 |
| New Mexico | 22.3% | 10.7% | 10.7% | -11.6% | -205,600 | 0.1% | 1,500 |
| New York | 12.5% | 7.0% | 6.7% | -5.8% | -961,800 | -0.3% | -58,600 |
| North Dakota | 12.0% | 9.1% | 8.7% | -3.3% | -17,500 | -0.4% | -2,700 |
| Ohio | 12.9% | 6.6% | 6.9% | -6.0% | -579,800 | 0.3% | 29,100 |
| Oregon | 17.5% | 7.3% | 8.1% | -9.4% | -296,500 | 0.8% | 28,900 |
| Pennsylvania | 11.5% | 7.0% | 6.6% | -4.8% | -508,400 | -0.3% | -35,400 |
| Rhode Island | 14.1% | 5.0% | 5.3% | -8.7% | -74,700 | 0.3% | 2,900 |
| Vermont | 8.3% | 4.4% | 5.1% | -3.2% | -17,100 | 0.7% | 3,300 |
| Washington | 16.2% | 6.9% | 7.1% | -9.2% | -519,300 | 0.2% | 15,800 |
| West Virginia | 16.3% | 6.0% | 7.1% | -9.2% | -141,400 | 1.1% | 13,600 |
| Non-Expansion States | 19.6% | 13.8% | 14.3% | -5.3% | -4,966,700 | 0.6% | 680,400 |
| Alabama | 16.0% | 10.9% | 11.3% | -4.7% | -191,700 | 0.4% | 16,200 |
| Florida | 24.4% | 15.3% | 15.9% | -8.5% | -1,179,400 | 0.6% | 133,400 |
| Georgia | 21.2% | 14.8% | 15.4% | -5.9% | -466,400 | 0.6% | 62,800 |
| Idaho | 18.6% | 12.1% | 12.6% | -6.0% | -73,400 | 0.6% | 10,900 |
| Kansas | 14.3% | 9.8% | 10.0% | -4.3% | -106,200 | 0.2% | 4,500 |
| Maine | 13.4% | 9.7% | 9.8% | -3.7% | -41,500 | 0.0% | -200 |
| Mississippi | 19.7% | 13.8% | 14.3% | -5.5% | -144,000 | 0.5% | 9,200 |
| Missouri | 15.3% | 10.6% | 10.8% | -4.5% | -228,800 | 0.2% | 6,100 |
| Nebraska | 12.4% | 10.3% | 10.0% | -2.4% | -35,300 | -0.3% | -4,500 |
| North Carolina | 18.2% | 12.3% | 12.7% | -5.5% | -422,500 | 0.4% | 38,500 |
| Oklahoma | 20.6% | 16.1% | 16.4% | -4.2% | -130,200 | 0.3% | 7,000 |
| South Carolina | 18.6% | 11.8% | 13.4% | -5.1% | -186,600 | 1.6% | 66,100 |
| South Dakota | 14.6% | 9.8% | 11.0% | -3.5% | -23,900 | 1.2% | 8,200 |
| Tennessee | 16.3% | 10.8% | 11.1% | -5.2% | -267,700 | 0.3% | 23,600 |
| Texas | 24.6% | 18.7% | 19.6% | -5.0% | -879,100 | 0.9% | 275,300 |
| Utah | 14.8% | 9.4% | 10.0% | -4.7% | -106,300 | 0.6% | 19,800 |
| Virginia | 14.2% | 10.3% | 10.2% | -3.9% | -266,700 | 0.0% | -400 |
| Wisconsin | 10.5% | 6.1% | 6.1% | -4.4% | -213,900 | -0.1% | -3,600 |
| Wyoming | 14.7% | 12.7% | 14.5% | -0.1% | -3,100 | 1.8% | 7,400 |
| NOTES: Includes
nonelderly individuals ages 0-64. Expansion status reflects the
implementation of Medicaid expansion as of
2017. SOURCE: Kaiser Family Foundation analysis of 2013, 2016, and 2017 American Community Survey (ACS), 1-Year Estimates. | |||||||
| Appendix Table B: Characteristics of the Nonelderly Uninsured, 2017 | |||||
| Nonelderly (millions) |
Percent of Nonelderly | Uninsured (millions) |
Percent of Uninsured | Uninsured Rate | |
| Total Nonelderly | 267.5 | 100.0% | 27.4 | 100.0% | 10.2% |
| Age | |||||
| Children – Total | 76.1 | 28.5% | 3.8 | 13.8% | 5.0% |
| Nonelderly Adults – Total | 191.4 | 71.5% | 23.6 | 86.2% | 12.3% |
| Adults 19 – 25 | 28.3 | 10.6% | 4.2 | 15.4% | 14.8% |
| Adults 26 – 34 | 39.1 | 14.6% | 6.1 | 22.3% | 15.6% |
| Adults 35 – 44 | 40.5 | 15.1% | 5.5 | 20.2% | 13.6% |
| Adults 45 – 54 | 41.8 | 15.6% | 4.5 | 16.3% | 10.7% |
| Adults 55 – 64 | 41.6 | 15.6% | 3.3 | 12.0% | 7.9% |
| Annual Family Income | |||||
| <$20,000 | 31.8 | 11.9% | 5.5 | 20.0% | 17.2% |
| $20,000 – <$40,000 | 42.8 | 16.0% | 7.4 | 27.0% | 17.3% |
| $40,000+ | 192.9 | 72.1% | 14.5 | 53.0% | 7.5% |
| Family Poverty Level | |||||
| <100% | 30.4 | 11.4% | 5.0 | 18.4% | 16.6% |
| 100% – <200% | 45.3 | 16.9% | 7.8 | 28.5% | 17.2% |
| 200% – <400% | 81.9 | 30.6% | 9.6 | 35.2% | 11.7% |
| 400%+ | 109.9 | 41.1% | 4.9 | 18.0% | 4.5% |
| Household Type | |||||
| 1 Parent with Children | 19.0 | 7.1% | 1.3 | 4.9% | 7.1% |
| 2 Parents with Children | 84.2 | 31.5% | 6.0 | 22.0% | 7.2% |
| Multigenerational | 18.7 | 7.0% | 2.2 | 7.9% | 11.6% |
| Adults Living Alone or with Other Adults | 111.7 | 41.8% | 13.2 | 48.3% | 11.8% |
| Other | 33.9 | 12.7% | 4.6 | 16.9% | 13.6% |
| Family Work Status | |||||
| 2+ Full-time | 101.8 | 38.1% | 8.6 | 31.5% | 8.5% |
| 1 Full-time | 119.3 | 44.6% | 12.4 | 45.3% | 10.4% |
| Only Part-time | 19.5 | 7.3% | 2.8 | 10.4% | 14.6% |
| Non-workers | 26.9 | 10.1% | 3.5 | 12.8% | 13.0% |
| Race/Ethnicity | |||||
| White | 154.3 | 57.7% | 11.3 | 41.3% | 7.3% |
| Black | 34.0 | 12.7% | 3.8 | 13.8% | 11.1% |
| Hispanic | 53.5 | 20.0% | 10.1 | 36.9% | 18.9% |
| Asian/N. Hawaiian and Pacific Islander | 15.9 | 5.9% | 1.1 | 4.2% | 7.2% |
| American Indian/Alaska Native | 1.8 | 0.7% | 0.4 | 1.5% | 22.0% |
| Two or More Races | 8.0 | 3.0% | 0.6 | 2.3% | 7.9% |
| Citizenship | |||||
| U.S. Citizen – Native | 230.6 | 86.2% | 18.9 | 69.2% | 8.2% |
| U.S. Citizen – Naturalized | 16.7 | 6.2% | 1.7 | 6.1% | 10.0% |
| Non-U.S. Citizen, Residents for <5 Years | 6.4 | 2.4% | 1.7 | 6.4% | 27.2% |
| Non-U.S. Citizen, Residents for 5+ Years | 13.9 | 5.2% | 5.0 | 18.3% | 36.0% |
| NOTES: Includes nonelderly individuals
ages 0-64. The U.S. Census Bureau’s poverty threshold for a family with
two adults and one child was $19,730 in 2017. Parent includes any person
with a dependent child. Multigenerational/other families with children
include families with at least three generations in a household, plus
families in which adults are caring for children other than their own.
Part-time workers were defined as working <35 hours per week.
Respondents who identify as mixed race who do not also identify as
Hispanic fall intot he “Two or More Races” category. All individuals who
identify as Hispanic ethnicity fall into the Hispanic category regardless
of race. SOURCE: Kaiser Family Foundation analysis of 2017 American Community Survey (ACS), 1-Year Estimates. | |||||
Kaiser Family Foundation analysis of 2017 American Community Survey (ACS), 1-Year Estimates.
Kaiser Family Foundation analysis of 2013 and 2016 American Community Survey (ACS), 1-Year Estimates.
Kaiser Family Foundation analysis of 2017 American Community Survey (ACS), 1-Year Estimates.
Rachel Garfield, Anthony Damico, Kendal Orgera, Gary Claxton, and Larry Levitt, Estimates of Eligibility for ACA Coverage among the Uninsured in 2016 (Washington, DC: Kaiser Family Foundation, June 2018), https://www.kff.org/uninsured/issue-brief/estimates-of-eligibility-for-aca-coverage-among-the-uninsured-in-2016/.
Ashley Kirzinger, Liz Hamel, Cailey Muñana, and Mollyann Brodie. Kaiser Health Tracking Poll – March 2018: Non-Group Enrollees, (Washington, D.C.: Kaiser Family Foundation, April 2018), https://www.kff.org/health-reform/poll-finding/kaiser-health-tracking-poll-march-2018-non-group-enrollees/.
Karen Pollitz, Jennifer Tolbert, and Ashley Semanskee. 2016 Survey of Health Insurance Marketplace Assister Programs and Brokers (Washington, DC: Kaiser Family Foundation, June 2016), https://www.kff.org/health-reform/report/2016-survey-of-health-insurance-marketplace-assister-programs-and-brokers/
Karen Pollitz, Jennifer Tolbert, and Maria Diaz. Data Note: Further Reductions in Navigator Funding for Federal Marketplace States, (Washington, D.C.: Kaiser Family Foundation, September 2018), https://www.kff.org/health-reform/issue-brief/data-note-further-reductions-in-navigator-funding-for-federal-marketplace-states/.
Kaiser Family Foundation analysis of the 2017 National Health Interview Survey.
Kaiser Family Foundation analysis of the March 2018 Current Population Survey, Annual Social and Economic Supplement.
Kaiser Family Foundation analysis of the March 2018 Current Population Survey, Annual Social and Economic Supplement.
Kaiser Family Foundation. 2018 Employer Health Benefits Survey (Washington, DC: Kaiser Family Foundation, October 2018), https://www.kff.org/health-costs/report/2018-employer-health-benefits-survey/.
State Health Facts. “Status of State Action on the Medicaid Expansion Decision.” Kaiser Family Foundation, 2018, https://www.kff.org/health-reform/state-indicator/state-activity-around-expanding-medicaid-under-the-affordable-care-act/.
Idaho, Nebraska, and Utah had ballot initiatives in the 2018 midterm elections on Medicaid expansion where each state voted to expand. Montana voters also had a ballot initiative that voted down the extension of Medicaid expansion, which is planned to end on June 30, 2019.
Tricia Brooks, Karina Wagnerman, Samantha Artiga, and Elizabeth Cornachione, Medicaid and CHIP Eligibility, Enrollment, Renewal, and Cost Sharing Policies as of January 2018: Findings from a 50-State Survey (Washington, DC: Kaiser Family Foundation, January 2018), https://www.kff.org/medicaid/report/medicaid-and-chip-eligibility-enrollment-renewal-and-cost-sharing-policies-as-of-january-2018-findings-from-a-50-state-survey/.
Rachel Garfield, Anthony Damico, and Kendal Orgera, The Coverage Gap: Uninsured Poor Adults in States that Do Not Expand Medicaid (Washington, DC: Kaiser Family Foundation, June 2018), https://www.kff.org/medicaid/issue-brief/the-coverage-gap-uninsured-poor-adults-in-states-that-do-not-expand-medicaid/.
Health Coverage of Immigrants (Washington, DC: Kaiser Family Foundation, December 2017), https://www.kff.org/disparities-policy/fact-sheet/health-coverage-of-immigrants/.
Kaiser Family Foundation analysis of 2017 American Community Survey (ACS), 1-Year Estimates.
$19,730 for a family of three in 2017.
Kaiser Family Foundation analysis of 2017 American Community Survey (ACS), 1-Year Estimates.
Kaiser Family Foundation analysis of 2017 American Community Survey (ACS), 1-Year Estimates.
Kaiser Family Foundation analysis of 2017 American Community Survey (ACS), 1-Year Estimates.
Kaiser Family Foundation analysis of 2017 American Community Survey (ACS), 1-Year Estimates.
Health Coverage of Immigrants (Washington, DC: Kaiser Family Foundation, December 2017), https://www.kff.org/disparities-policy/fact-sheet/health-coverage-of-immigrants/.
Kaiser Family Foundation analysis of the 2017 National Health Interview Survey.
Jack Hadley, “Insurance Coverage, Medical Care Use, and Short-term Health Changes Following an Unintentional Injury or the Onset of a Chronic Condition.” JAMA 297, no. 10 (March 2007):1073-84.
Stacey McMorrow, Genevieve M. Kenney, and Dana Goin,“Determinants of Receipt of Recommended Preventive Services: Implications for the Affordable Care Act,” American Journal of Public Health 104, no. 12 (Dec 2014): 2392-9.
Kaiser Family Foundation analysis of the 2017 National Health Interview Survey.
Jack Hadley, “Insurance Coverage, Medical Care Use, and Short-term Health Changes Following an Unintentional Injury or the Onset of a Chronic Condition,” JAMA 297, no. 10 (March 2007): 1073-84.
Marco A Castaneda and Meryem Saygili, “The health conditions and the health care consumption of the uninsured,” Health Economics Review (2016).
Steffie Woolhandler, et al., “The Relationship of Health Insurance and Mortality: Is Lack of Insurance Deadly?” Annals of Internal Medicine 167 (June 2017): 424-431.
Destini A Smith, et al., “The effect of health insurance coverage and the doctor-patient relationship on health care utilization in high poverty neighborhoods.” Preventive Medicine Reports 7 (2017): 158-161.
Andrea S. Christopher, et al., “Access to Care and Chronic Disease Outcomes Among Medicaid-Insured Persons Versus the Uninsured,” American Journal of Public Health 106, no. 1 (January 2016): 63-69.
Amy Finkelstein, et. al, “The Oregon Health Insurance Experiment: Evidence from the First Year” (National Bureau of Economic Research, July 2011), http://www.nber.org/papers/w17190.
Larisa Antonisse, Rachel Garfield, Robin Rudowitz, and Samantha Artiga, The Effects of Medicaid Expansion on the ACA: Updated Findings From a Literature Review (Washington, D.C.: Kaiser Family Foundation, March 2018), https://www.kff.org/medicaid/issue-brief/the-effects-of-medicaid-expansion-under-the-aca-updated-findings-from-a-literature-review-march-2018/.
Sara Rosenbaum, Jennifer Tolbert, Jessica Sharac, Peter Shin, Rachel Gunsalus, and Julia Zur, Community Health Centers: Growing Important in a Changing Health Care System, (Washington, DC: Kaiser Family Foundation, March 2018), https://www.kff.org/medicaid/issue-brief/community-health-centers-growing-importance-in-a-changing-health-care-system/.
Allen Dobson, Joan DaVanzo, Randy Haught, and Phap-Hoa Luu, Comparing the Affordable Care Act’s Financial Impact on Safety-Net Hospitals in States That Expanded Medicaid and Those That Did Not, (New York, NY: The Commonweath Fund, November 2017), https://www.commonwealthfund.org/publications/issue-briefs/2017/nov/comparing-affordable-care-acts-financial-impact-safety-net.
Jane Wishner, et al., A Look at Rural Hospital Closures and Implications for Access to Care: Three Case Studies (Washington, DC: The Urban Institute and Kaiser Family Foundation, July 2016), https://www.kff.org/report-section/a-look-at-rural-hospital-closures-and-implications-for-access-to-care-three-case-studies-issue-brief/.
Sherry Glied and Richard Kronick, The Value of Health Insurance: Few of the Uninsured Have Adequate Resources to Pay Potential Hospital Bills (Washington, DC: Office of Assistant Secretary for Planning and Evaluation, HHS, May 2011), http://aspe.hhs.gov/health/reports/2011/ValueofInsurance/rb.pdf
Philippe Gwet, Jerrod Anderson, and Steven Machlin, “Out-of-Pocket Health Care Expenses in the U.S. Civilian Noninstitutionalized Population by Age and Insurance Coverage, 2014,” Agency for Healthcare Research and Quality (AHRQ), Statistical Brief #495, https://meps.ahrq.gov/data_files/publications/st495/stat495.shtml.
Tim Xu, Angela Park, Ge Bai, Sarah Joo, Susan Hutfless, Ambar Mehta, Gerard Anderson, and Martin Makary, “Variation in Emergency Department vs Internal Medicine Excess Charges in the United States,” JAMA Intern Med. 177(8): 1130-1145 (June 2017), https://jamanetwork.com/journals/jamainternalmedicine/fullarticle/2629494%20.
Stacie Dusetzina, Ethan Basch, and Nancy Keating, “For Uninsured Cancer Patients, Outpatient Charges Can Be Costly, Putting Treatments out of Reach,” Health Affairs 34, no. 4 (April 2015): 584-591, http://content.healthaffairs.org/content/34/4/584.abstract
Kaiser Family Foundation analysis of the 2017 National Health Interview Survey.
Liz Hamel, Mira Norton, Karen Pollitz, Larry Levitt, Gary Claxton, and Mollyann Brodie, The Burden of Medical Debt: Results from the Kaiser Family Foundation/New York Times Medical Bills Survey, (Washington, D.C.: Kaiser Family Foundation, Jan 2016), http://kff.org/health-costs/report/the-burden-of-medical-debt-results-from-the-kaiser-family-foundationnew-york-times-medical-bills-survey/.
Consumer Financial Protection Bureau, “Consumer Experiences with Debt Collection: Findings from the CFPB’s Survey of Consumer Views on Debt.” (Consumer Financial Protection Bureau: January 2017),
Liz Hamel, Mira Norton, Karen Pollitz, Larry Levitt, Gary Claxton, and Mollyann Brodie, The Burden of Medical Debt: Results from the Kaiser Family Foundation/New York Times Medical Bills Survey (Washington, D.C.: Kaiser Family Foundation, January 2016), https://www.kff.org/report-section/the-burden-of-medical-debt-section-1-who-has-medical-bill-problems-and-what-are-the-contributing-factors/.
Larisa Antonisse, Rachel Garfield, Robin Rudowitz, and Samantha Artiga, The Effects of Medicaid Expansion on the ACA: Updated Findings From a Literature Review (Washington, D.C.: Kaiser Family Foundation, March 2018), https://www.kff.org/medicaid/issue-brief/the-effects-of-medicaid-expansion-under-the-aca-updated-findings-from-a-literature-review-march-2018/.
Ibid.